Overall statistics
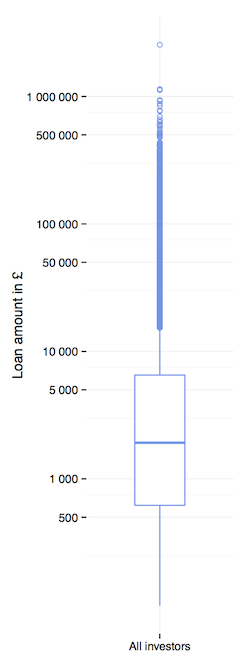
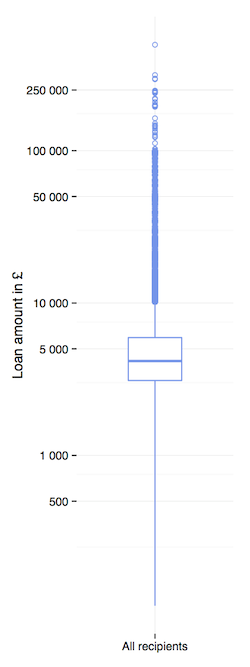
The total amount of P2P loans in the sample was £378.3 million. In the data, the UK market from Oct 2010 to May 2013, we can identify 48,891 lenders and 59,851 recipients (see Methodology for details and caveats). Table 1.1 shows the average loan and Figure 1.1 and 1.2 the whole distribution across lenders and recipients.
The unit of analysis is a loan part. In total there are 13,924,547 loan parts. A recipient who takes out a loan of, for example, £5,000 may receive the money from hundreds of different lenders. Vice versa, a lender may subdivide her investment into many loans. A typical (median, see explanation) amount for a loan part is £10. However, in a small number of cases the investment per loan part is substantially larger.
Table 1.1 Descriptive statistics for lenders and recipients
| Lender | Recipient | |
|---|---|---|
| Mean loan | £7,737 | £6,320 |
| Median loan | £1,290 | £4,160 |
| Standard deviation | £29,369 | £11,060 |
The table above speaks a clear language: lenders are much more skewed towards large loan amounts than recipients. The salient difference in mean and median loan values, as well as the large standard deviation, are a hint that a few lenders use large sums, whereas most recipients deal with amounts between £3,000 to £6,000. This result makes intuitive sense because lenders have more financial freedom than recipients and this is also reflected in the following box plots.
Figure 1.1 Box plot for loan amounts of lenders (logarithmic scale) |
Figure 1.2 Box plot for loan amounts of recipients (logarithmic scale) |
|---|---|
 |
 |
Growth over time
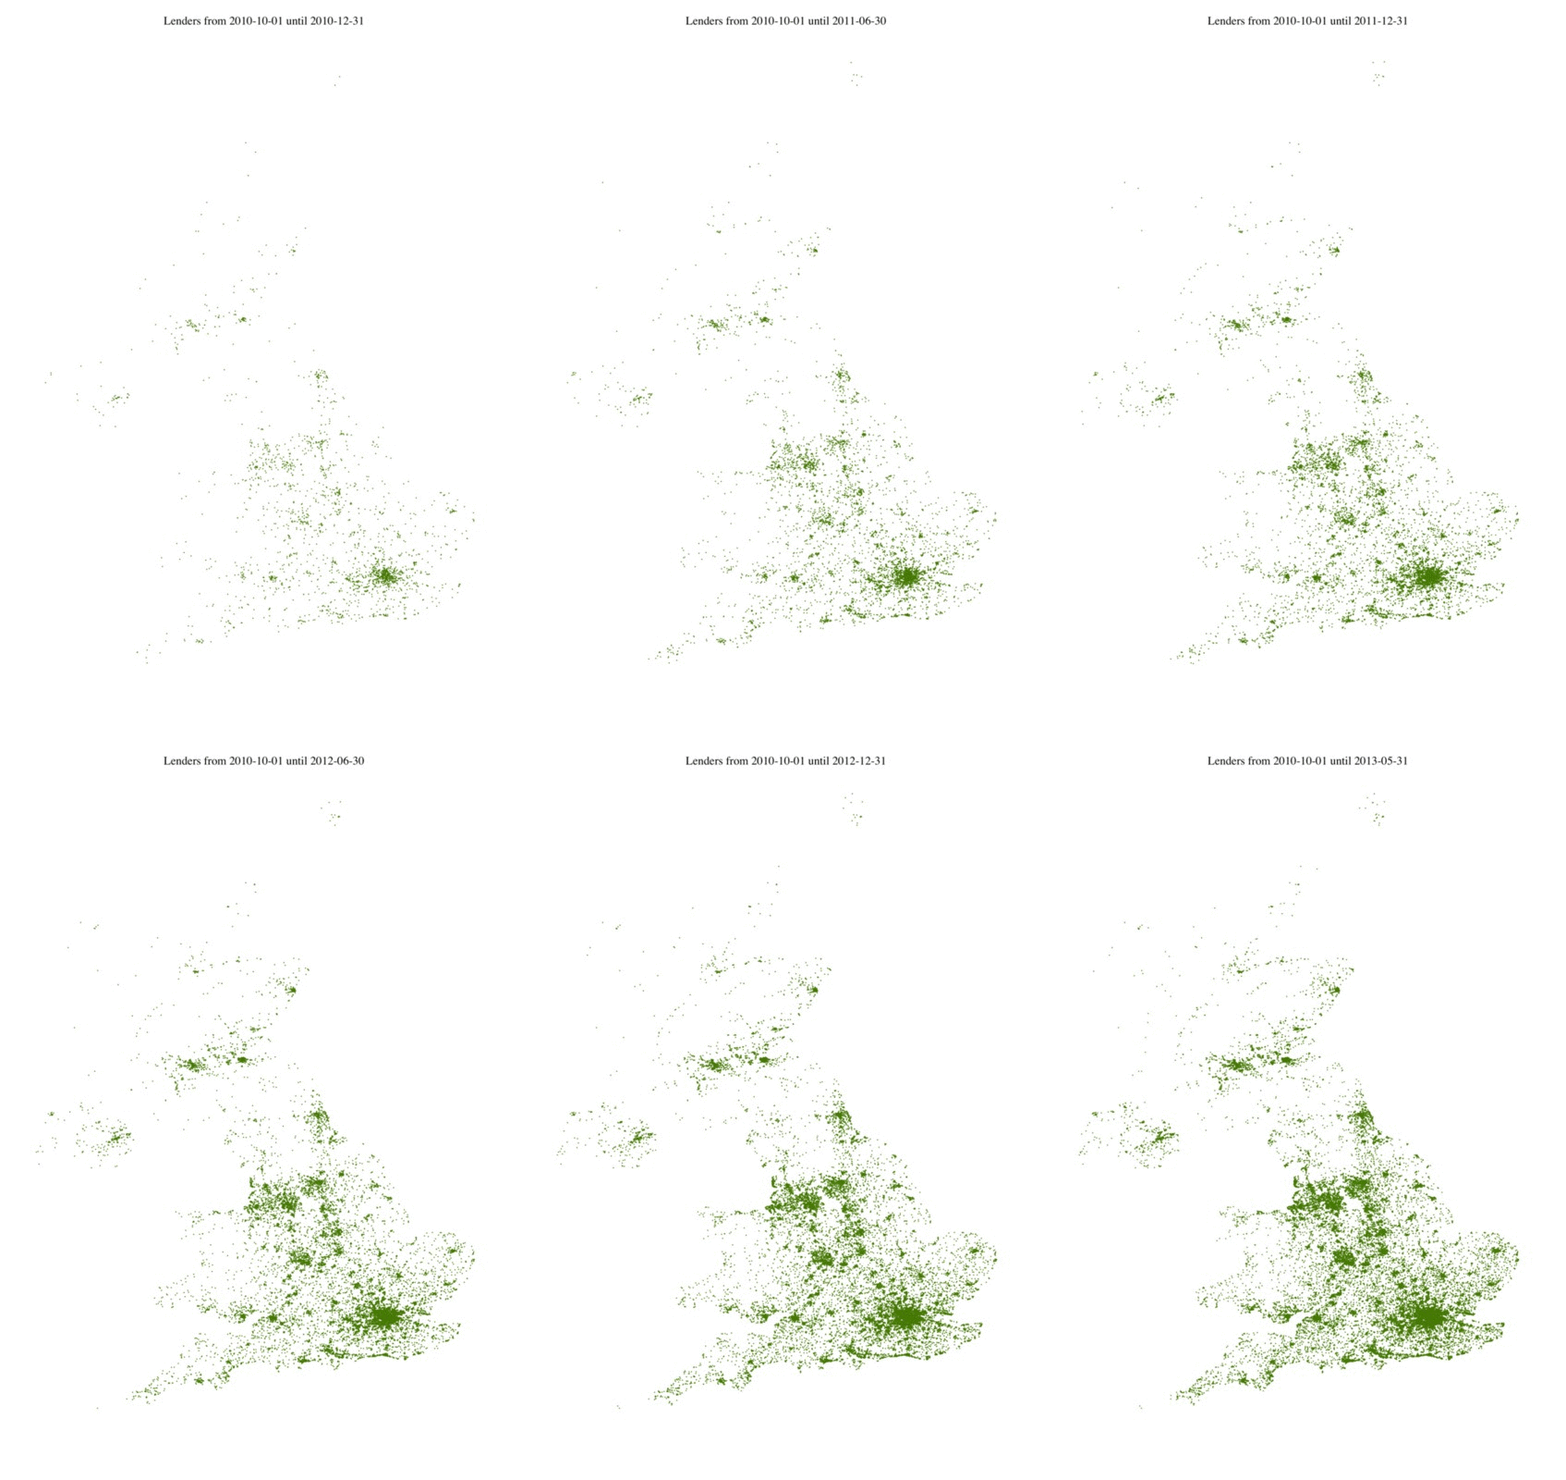
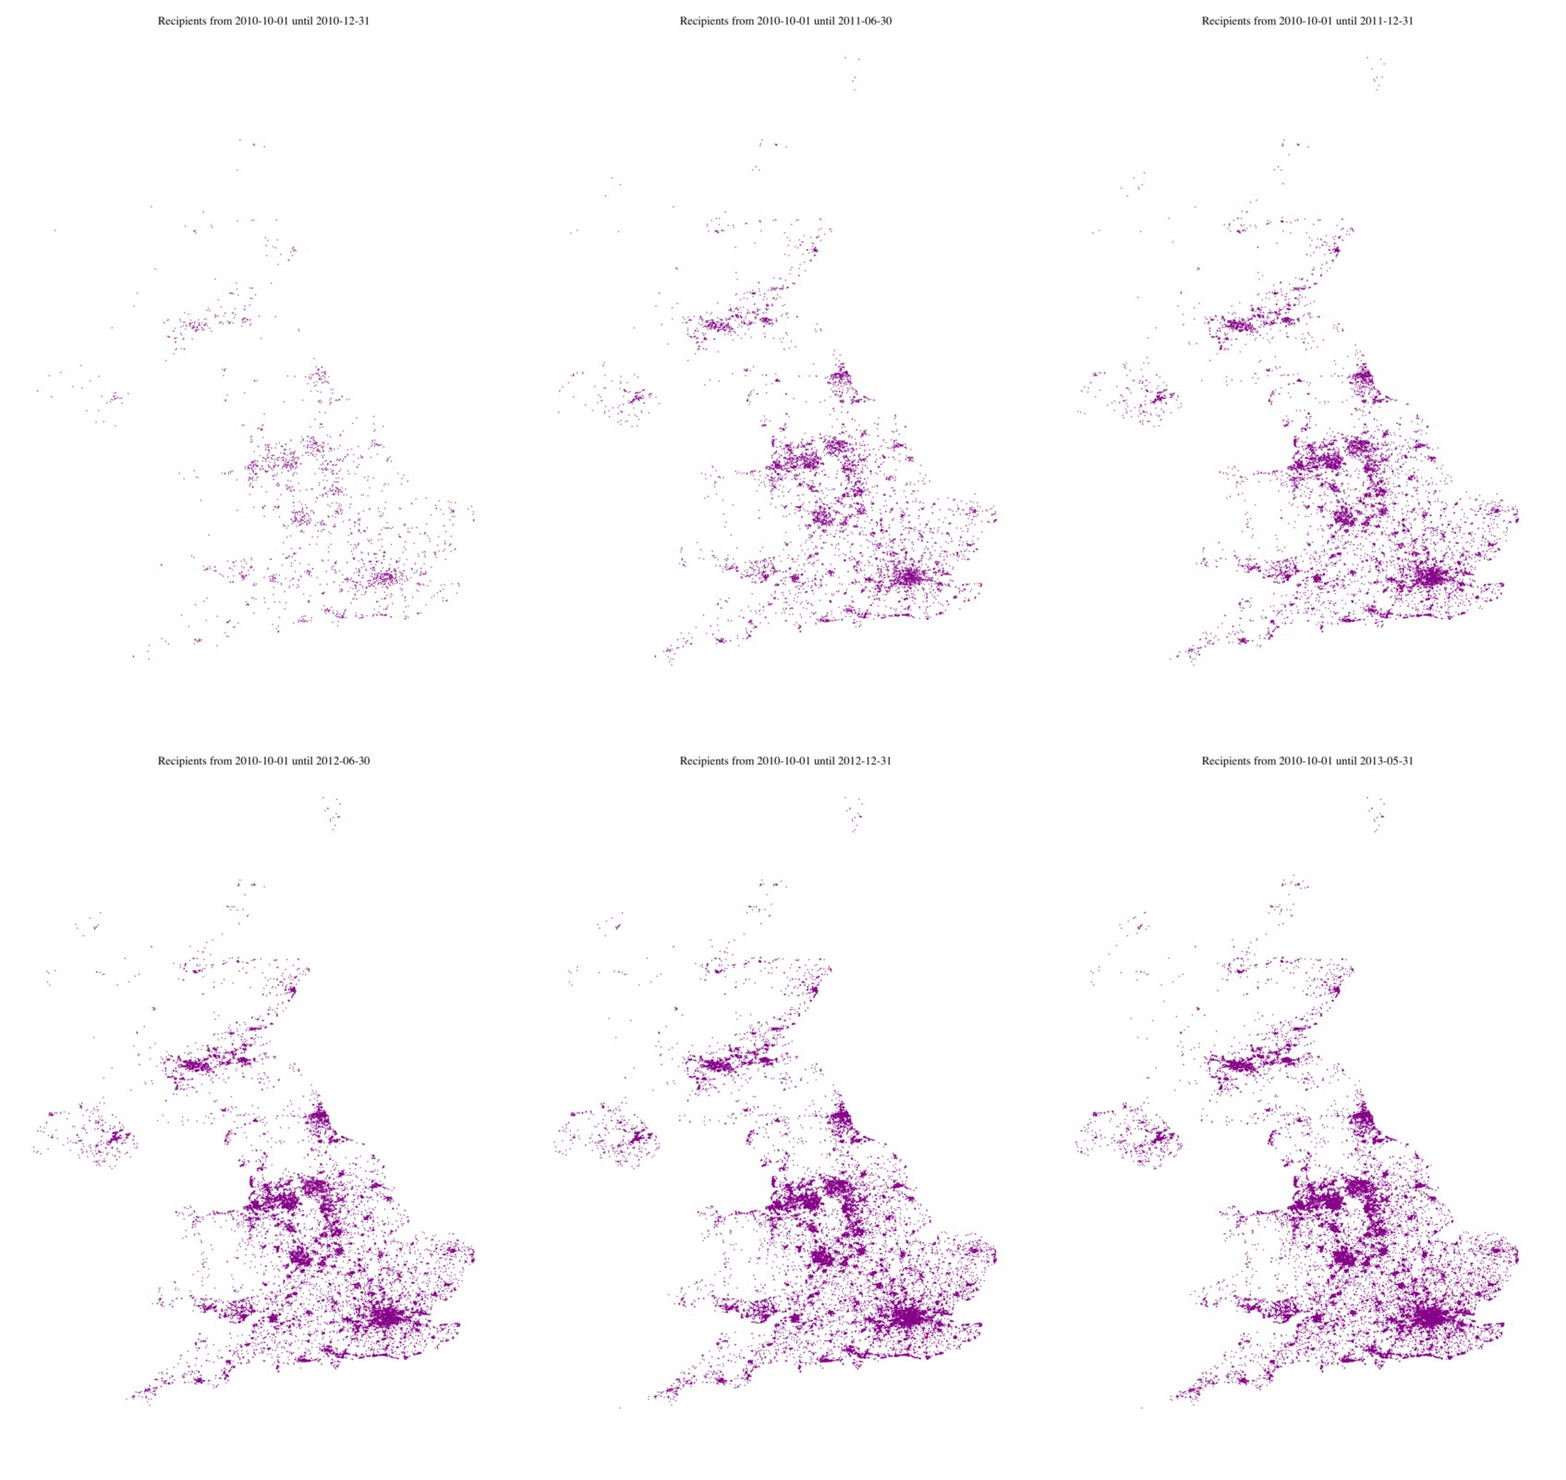
The P2P market has been growing steadily since its early days. In particular, we can compare the number of lenders and recipients at the beginning of the period (end of 2010) with the end of period (May 2013). The following maps plot the individual postcodes of lenders and recipients. Notice how there are no country boundaries and the maps emerge entirely from the postcodes.
Map 1.1 Growth of lenders over time |
Map 1.2 Growth of recipients over time |
|---|---|
 |
 |
Regional flows
Each loan part has a postcode for the lender and the recipient. Thus, we can calculate regional flows at any level in the UK. Table 1.2 is aggregated on a regional level. Perhaps not surprisingly, London is the biggest lender and the second biggest recipient. Only the South East receives more financial resources from the P2P market.
Four regions have a positive balance; they invest more than they receive. All four regions, London, South East, South West and the East of England lie in the South of the UK. We can also look at more detailed patterns (see Appendix). However, bear in mind that the regional allocation is, in most cases, not a deliberate decision because of the platforms' functionalities. This depends on the platform itself. There may occur regional allocations based on implicit selection such as the loan rate. Therefore the findings in the appendix allude more to the robust nature of the market than personal investment decisio)ns.
Table 1.2 Regional statistics and population figures (in £ and £ per person)
| Region | As lender | As recipient | Net sum | Population | Investment (£ p.p.) | Receiving (£ p.p.) | Net sum (£ p.p.) |
|---|---|---|---|---|---|---|---|
| London | 96,535,000 | 48,725,000 | 47,810,000 | 8,204,000 | 11.8 | 5.9 | 5.8 |
| South East | 76,353,000 | 57,602,000 | 18,751,000 | 8,653,000 | 8.8 | 6.7 | 2.2 |
| South West | 41,144,000 | 32,076,000 | 9,068,000 | 5,301,000 | 7.8 | 6.1 | 1.7 |
| East of England | 37,243,000 | 29,748,000 | 7,495,000 | 5,862,000 | 6.4 | 5.1 | 1.3 |
| West Midlands | 21,207,000 | 29,978,000 | -8,771,000 | 5,609,000 | 3.8 | 5.3 | -1.6 |
| East Midlands | 15,665,000 | 25,239,000 | -9,574,000 | 4,537,000 | 3.5 | 5.6 | -2.1 |
| North West | 26,803,000 | 42,434,000 | -15,631,000 | 7,056,000 | 3.8 | 6.0 | -2.2 |
| Yorkshire and The Humber | 20,584,000 | 32,756,000 | -12,172,000 | 5,288,000 | 3.9 | 6.2 | -2.3 |
| Northern Ireland | 2,527,000 | 6,993,000 | -4,466,000 | 1,807,000 | 1.4 | 3.9 | -2.5 |
| Scotland | 19,219,000 | 33,108,000 | -13,889,000 | 5,255,000 | 3.7 | 6.3 | -2.6 |
| Wales | 12,880,000 | 22,355,000 | -9,475,000 | 3,064,000 | 4.2 | 7.3 | -3.1 |
| North East | 8,104,000 | 17,250,000 | -9,146,000 | 2,596,000 | 3.1 | 6.6 | -3.5 |
We included some external open data, namely population estimates from the UK census for each of the region. From this we can "normalise" (divide) the regional figures by population. London still tops the list with £12 per person of lending. The differences across regions are more pronounced among lenders. The range of lending per person ranges from £1.4 to £11.8 for UK regions, whereas the range for recipients only goes from £3.9 to £7.3 per person. Hence, there is substantially more lending in London and the South of the UK, whilst recipients are more evenly distributed across the country.
Loan rates and term per region
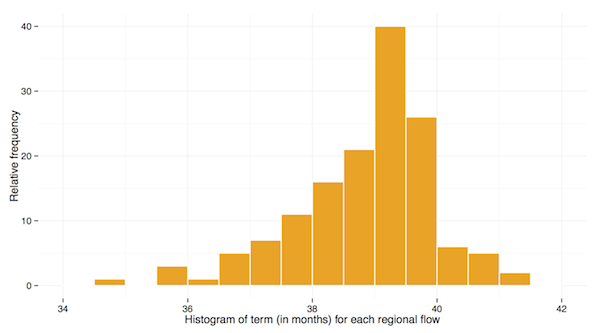
The UK has 12 regions and because a region can lend itself money there are a total of 144 possible combination for different flows. For each tuple, e.g. London lending to the South East, we calculated the average loan rate and average length (see weights for details).
In both cases, loan rates and term, we find that the variation between region is surprisingly low. On average loans are priced between 6.1% and 6.7% and have a length of 37 to 41 months.
There is no salient pattern for recipients when it comes to interest rates. The lowest rates for lenders, on the other hand, are all in the East of England. This fits with the fact that those loans are also slightly shorter compared to the rest of the UK.
Figure 1.3 Histogram of loan rates for each regional flow
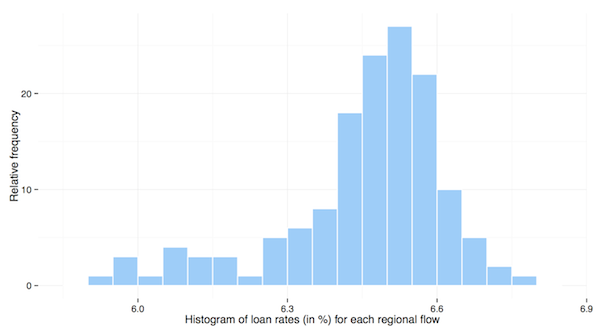
Figure 1.4 Histogram of terms for each regional flow
Counties
Similarly to regions, we can calculate statistics for English counties. Table 1.3 shows total amount for lenders and recipients for each English county. The net is calculated as the difference, i.e. lending - receiving. The visualisation on the front page provides further tools to explore the data.
Table 1.3 Loan amounts for English Counties (in £)
| County | Lending | Receiving | Net |
|---|---|---|---|
| Buckinghamshire | 8,533,000 | 3,974,000 | 4,559,000 |
| Cambridgeshire | 7,557,000 | 3,569,000 | 3,988,000 |
| Cumbria | 3,504,000 | 3,532,000 | -28,000 |
| Derbyshire | 2,877,000 | 5,046,000 | -2,169,000 |
| Devon | 6,759,000 | 3,786,000 | 2,973,000 |
| Dorset | 3,628,000 | 1,955,000 | 1,673,000 |
| East Sussex | 3,915,000 | 3,222,000 | 693,000 |
| Essex | 10,802,000 | 8,587,000 | 2,215,000 |
| Gloucestershire | 5,171,000 | 4,569,000 | 602,000 |
| Hampshire | 12,041,000 | 9,255,000 | 2,786,000 |
| Hertfordshire | 11,686,000 | 8,230,000 | 3,456,000 |
| Kent | 9,891,000 | 8,687,000 | 1,204,000 |
| Lancashire | 6,346,000 | 8,549,000 | -2,203,000 |
| Leicestershire | 3,409,000 | 5,191,000 | -1,782,000 |
| Lincolnshire | 2,957,000 | 4,594,000 | -1,637,000 |
| Norfolk | 5,436,000 | 4,870,000 | 566,000 |
| North Yorkshire | 4,176,000 | 3,983,000 | 193,000 |
| Northamptonshire | 3,463,000 | 5,018,000 | -1,555,000 |
| Nottinghamshire | 2,810,000 | 6,056,000 | -3,246,000 |
| Oxfordshire | 8,573,000 | 5,625,000 | 2,948,000 |
| Somerset | 3,196,000 | 2,939,000 | 257,000 |
| Staffordshire | 2,680,000 | 5,797,000 | -3,117,000 |
| Suffolk | 4,071,000 | 4,331,000 | -260,000 |
| Surrey | 16,169,000 | 8,819,000 | 7,350,000 |
| Warwickshire | 3,271,000 | 4,323,000 | -1,052,000 |
| West Sussex | 6,903,000 | 5,879,000 | 1,024,000 |
| Worcestershire | 4,764,000 | 3,921,000 | 843,000 |
Appendix
All tables can be downloaded as a csv-file in the “Get the data” section.
Table A.1 Detailed regional flows within the UK
| Recipient —> | East Midlands | East of England | London | North East | North West | Northern Ireland | Scotland | South East | South West | Wales | West Midlands | Yorkshire and The Humber | Grand Total |
|---|---|---|---|---|---|---|---|---|---|---|---|---|---|
| East Midlands | 1,082,239 | 1,253,465 | 1,931,601 | 717,833 | 1,734,419 | 313,874 | 1,382,597 | 2,345,638 | 1,358,018 | 942,027 | 1,253,462 | 1,350,242 | 15,665,415 |
| East of England | 2,540,988 | 3,017,567 | 4,882,314 | 1,694,655 | 4,176,652 | 717,684 | 3,265,778 | 5,571,834 | 3,144,042 | 2,179,792 | 2,906,871 | 3,144,891 | 37,243,068 |
| London | 6,459,724 | 7,583,354 | 12,715,278 | 4,441,576 | 10,746,336 | 1,779,919 | 8,368,098 | 14,754,875 | 8,026,654 | 5,752,434 | 7,598,439 | 8,308,033 | 96,534,720 |
| North East | 528,270 | 614,205 | 1,071,738 | 377,020 | 906,671 | 143,762 | 693,511 | 1,243,873 | 706,912 | 499,775 | 628,509 | 690,172 | 8,104,418 |
| North West | 1,773,710 | 2,111,984 | 3,452,080 | 1,215,997 | 3,034,572 | 534,488 | 2,364,109 | 4,192,762 | 2,198,661 | 1,528,435 | 2,074,845 | 2,321,100 | 26,802,743 |
| Northern Ireland | 167,270 | 209,193 | 320,520 | 112,201 | 282,502 | 50,969 | 214,199 | 378,503 | 210,116 | 155,717 | 207,733 | 217,744 | 2,526,667 |
| Scotland | 1,303,323 | 1,486,973 | 2,376,384 | 853,753 | 2,162,910 | 354,436 | 1,719,886 | 2,946,097 | 1,649,782 | 1,132,434 | 1,529,130 | 1,703,767 | 19,218,875 |
| South East | 4,995,008 | 6,017,186 | 9,704,289 | 3,501,018 | 8,535,475 | 1,390,057 | 6,752,562 | 11,621,726 | 6,602,483 | 4,471,171 | 6,026,293 | 6,735,416 | 76,352,684 |
| South West | 2,750,730 | 3,272,974 | 5,222,877 | 1,834,053 | 4,647,748 | 748,696 | 3,603,066 | 6,166,448 | 3,584,220 | 2,412,801 | 3,310,944 | 3,589,759 | 41,144,316 |
| Wales | 858,358 | 966,830 | 1,595,339 | 583,999 | 1,462,615 | 220,910 | 1,125,068 | 1,947,737 | 1,131,198 | 789,822 | 1,036,950 | 1,160,819 | 12,879,645 |
| West Midlands | 1,446,493 | 1,614,029 | 2,763,484 | 940,242 | 2,388,386 | 371,647 | 1,873,382 | 3,277,501 | 1,767,179 | 1,264,677 | 1,754,851 | 1,745,311 | 21,207,182 |
| Yorkshire and The Humber | 1,333,135 | 1,600,036 | 2,688,715 | 977,471 | 2,355,817 | 366,425 | 1,745,760 | 3,154,933 | 1,697,169 | 1,226,066 | 1,649,746 | 1,788,410 | 20,583,683 |
| Grand Total | 25,239,248 | 29,747,796 | 48,724,619 | 17,249,818 | 42,434,103 | 6,992,867 | 33,108,016 | 57,601,927 | 32,076,434 | 22,355,151 | 29,977,773 | 32,755,664 | 378,263,416 |